


 140 / 150

138
Maybank Sustainability Report
2014
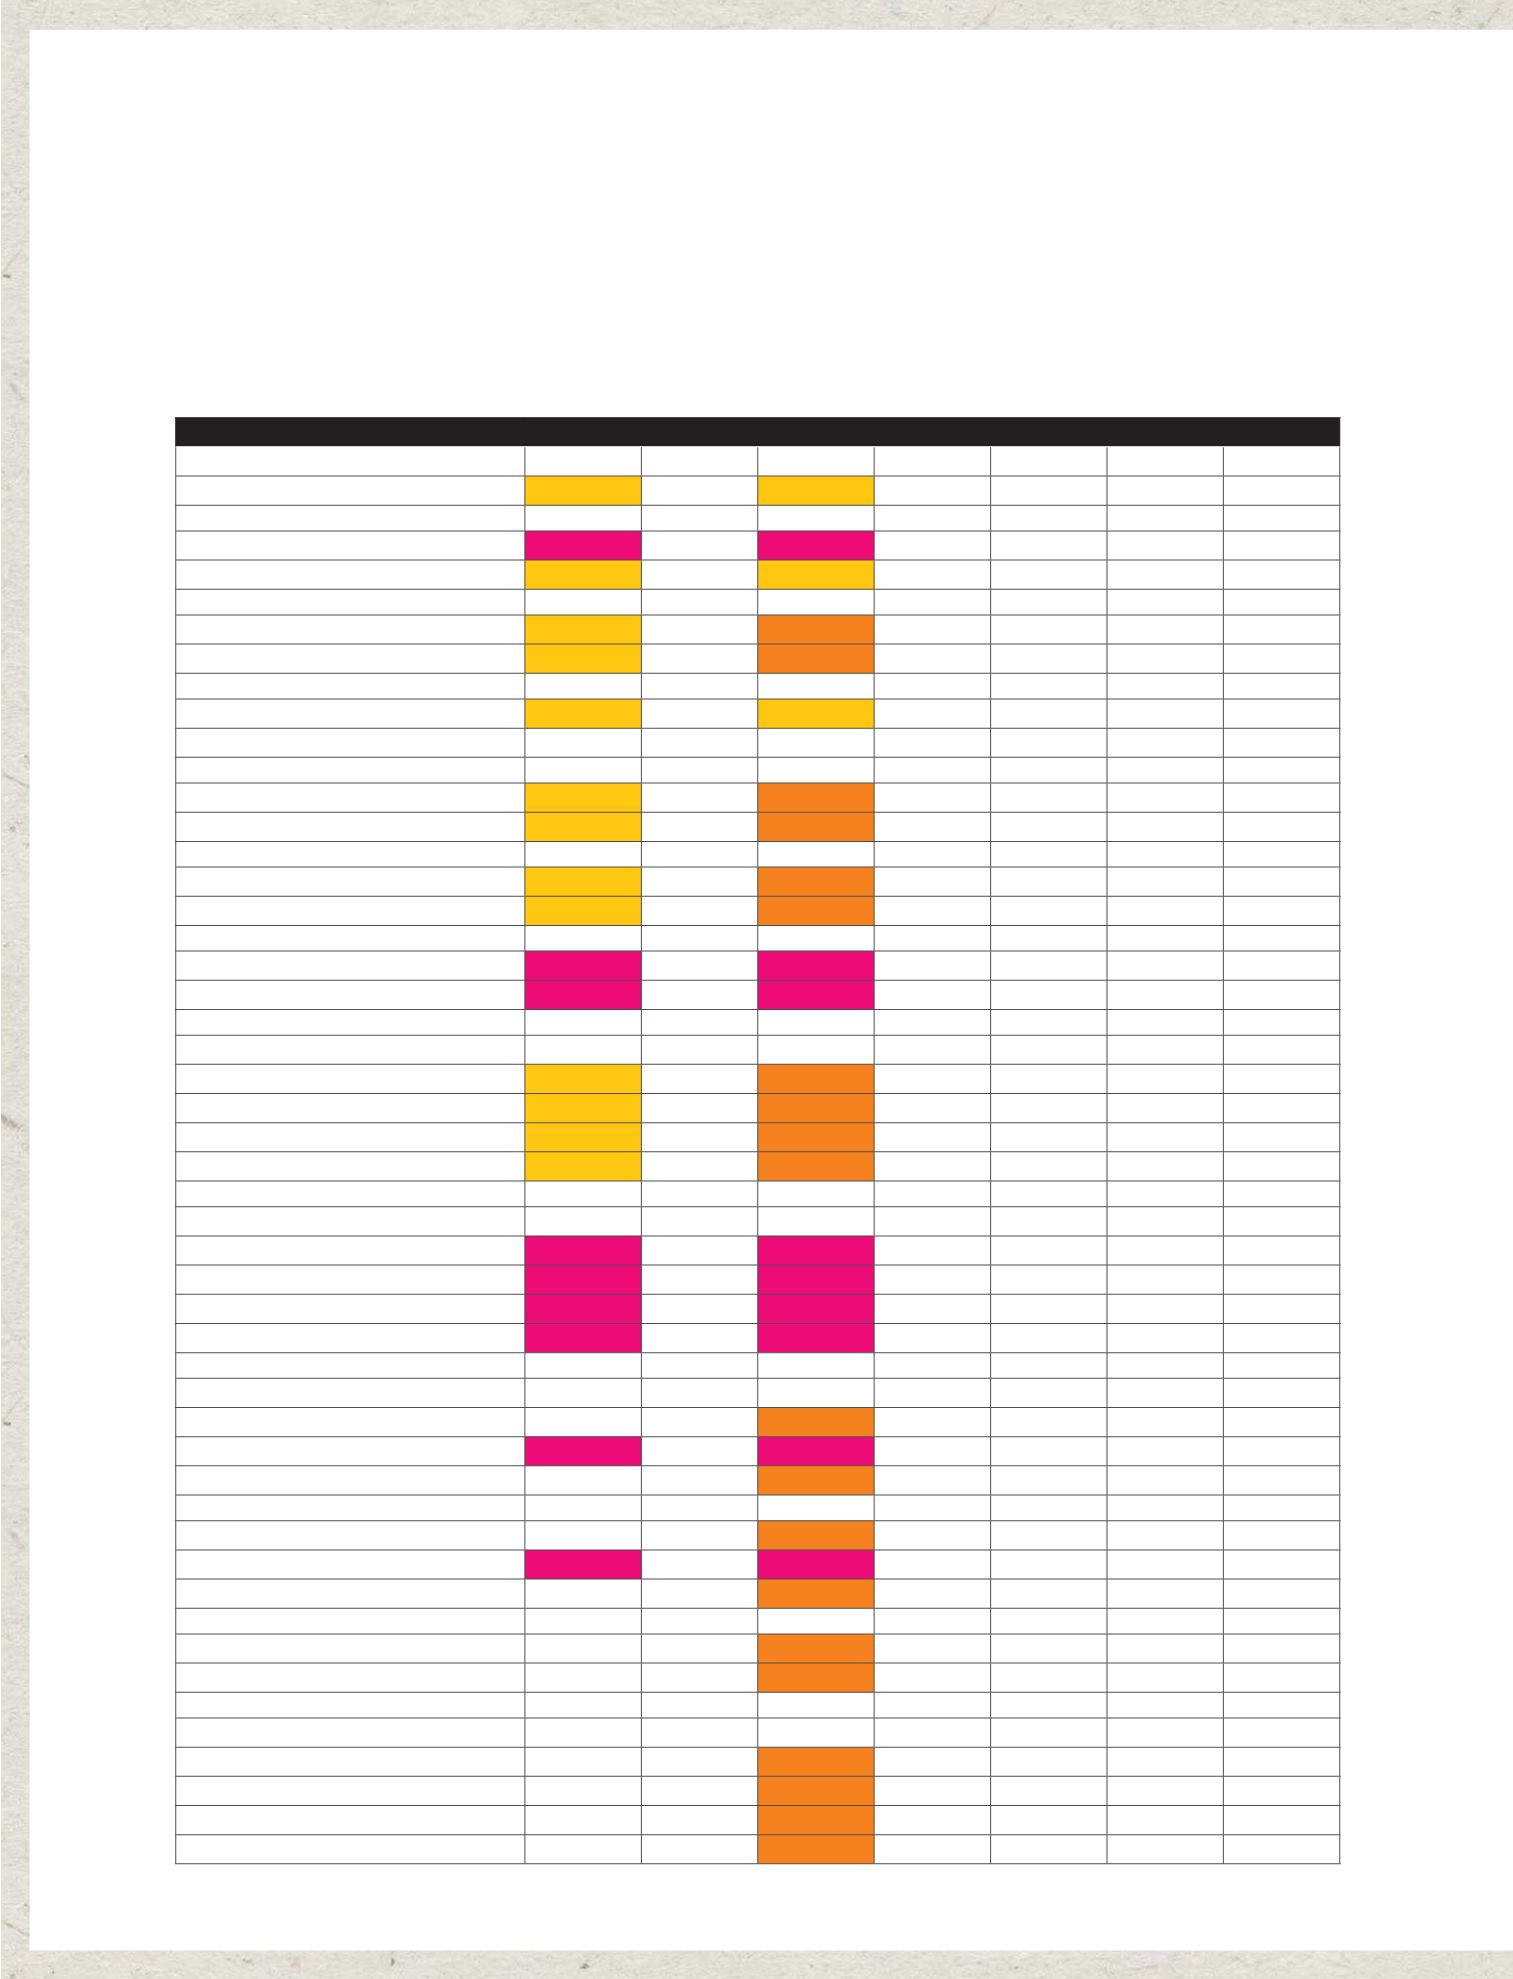
PerformanceData -
Workplace
DESCRIPTION
2014
2013
2012
2011
2010
2009
2008
Employees
Total number*
47,041
47,771
47,233
42,693
26,548
24,910
24,773
Inside Malaysia
26,272
26,728
26,473
25,841
23,925
22,535
22,370
Outside Malaysia*
20,769
21,043
20,760
16,852
2,623
2,375
2,403
Executive
31,096
31,702
26,746
28,578
16,675
14,564
14,021
Non-Executive
15,945
16,069
16,456
14,115
9,873
10,346
10,752
Full-time
47,041
47,771
47,233
42,693
26,548
24,910
24,773
Part-time
-
0
-
-
-
-
-
Permanent Staff
42,986
43,904
40,660
39,487
25,344
24,126
24,244
Non-permanent Staff
4,055
3,867
2,542
3,206
1,204
784
529
Female
25,285
25,498
23,415
22,845
15,691
14,554
14,488
Male
21,756
22,273
19,787
19,848
10,857
10,356
10,285
Union members (For Maybank only)
9,054
12,563
10,328
10,015
9,907
11,676
11,822
Non-Union members (For Maybank only)
13,237
14,165
16,145
13,052
11,457
13,234
12,951
Age group
< 30
13,355
14,262
13,108
13,481
7,116
6,400
7,083
30 - 40
17,686
18,121
16,962
17,177
11,178
11,208
10,924
40 - 50
12,054
11,913
10,311
9,491
6,221
5,655
5,336
> 50
3,946
3,475
2,821
2,544
2,033
1,647
1,430
Diversity (Malaysia Ops. only)
Malay
18,342
18,578
19,560
18,201
17,735
16,499
16,654
Chinese
5,351
5,536
5,394
5,189
6,021
5,466
5,257
Indian
1,416
1,400
1,381
1,355
1,298
1,221
1,203
Others
1,163
1,214
1,138
1,096
1,494
1,724
1,659
Employee Turnover Rates
Global
6,606
6,045
4,978
5,274
2,354
2,099
2,039
In Malaysia
2,101
1,921
1,950
1,742
1,866
1,800
1,559
Outside Malaysia
4,505
4,124
3,028
3,532
488
299
480
Global
14%
13%
11.52% 12.35% 8.87% 8.43% 8.23%
In Malaysia
8%
7%
7.37% 6.74% 7.80% 7.99% 6.97%
Outside Malaysia
22%
20% 18.10% 20.96% 18.60% 12.59% 19.98%
Female
3,103
2,786
2,291
2,267
1,275
1,122
1,148
Male
3,503
3,259
2,687
3,007
1,079
977
891
Age Group
< 30
3,035
3,272
2,803
3,095
1,340
1,191
1,178
30 - 40
2,243
1,735
1,428
1,529
540
487
523
40 - 50
973
608
382
368
194
153
150
> 50
355
430
365
282
280
268
188
t
Non-group; exclude Maybank Kim Eng & BII
t
Malaysia only
t
excluding BII
t
Group
G4-LA9, G4-10,G4-12, G4-LA1, G4-LA6, G4-LA12