


 7 / 150

5
Maybank Sustainability Report
2014
SIGNIFICANT EVENTS IN 2014
15 January -
Maybank Premier Wealth was
launched in Singapore andMalaysia.
4 February
-
Maybank became the first bank
to offer trade financing in Malaysian Ringgit
(RM) across China through branches in Beijing
and Shanghai.
13 February -
John Chong was appointed as
CEO of Maybank Kim Eng Group and Maybank
Investment Bank Berhad.
23May -
Maybank launched its inaugural
TOKYO PRO-BOND Market listed transaction,
raising JPY31.1 billion (USD305 million).
18 June -
BII issued subordinated debt of IDR1.5
trillion and Mudharabah Sukuk of IDR300 billion.
12 August -
Maybank launched its life insurance
arm, Etiqa Insurance Pte. Ltd., to distribute
products through Maybank Singapore.
29 August -
Amirul Feisal Wan Zahir was appointed
as Group Head of Global Banking (GB), effective
1 October.
8 September -
Maybank launched itsMaybank2u
(M2U) app, enabling allM2Utransactions ona
smartphone.
1 October -
Maybank was granted a banking
licence to open a branch in Myanmar.
31 October -
Maybank launched
myTrade2Cash, a centralised online trade
financing facility for SMEs and the first of its
kind in ASEAN, offered in collaboration with
Dagang NeXchange Bhd.
28 November -
BII shareholders approved a
rights issue of IDR1.5 trillion at the Extraordinary
General Meeting.
28 November -
Maybank launched its inaugural
GreTai SecuritiesMarket listedUSD500million
Notes.
18 December -
Maybank (Cambodia) Plc.
launched Maybank Premier Wealth at the
official opening ceremony of Maybank’s 18
th
branch in Cambodia.
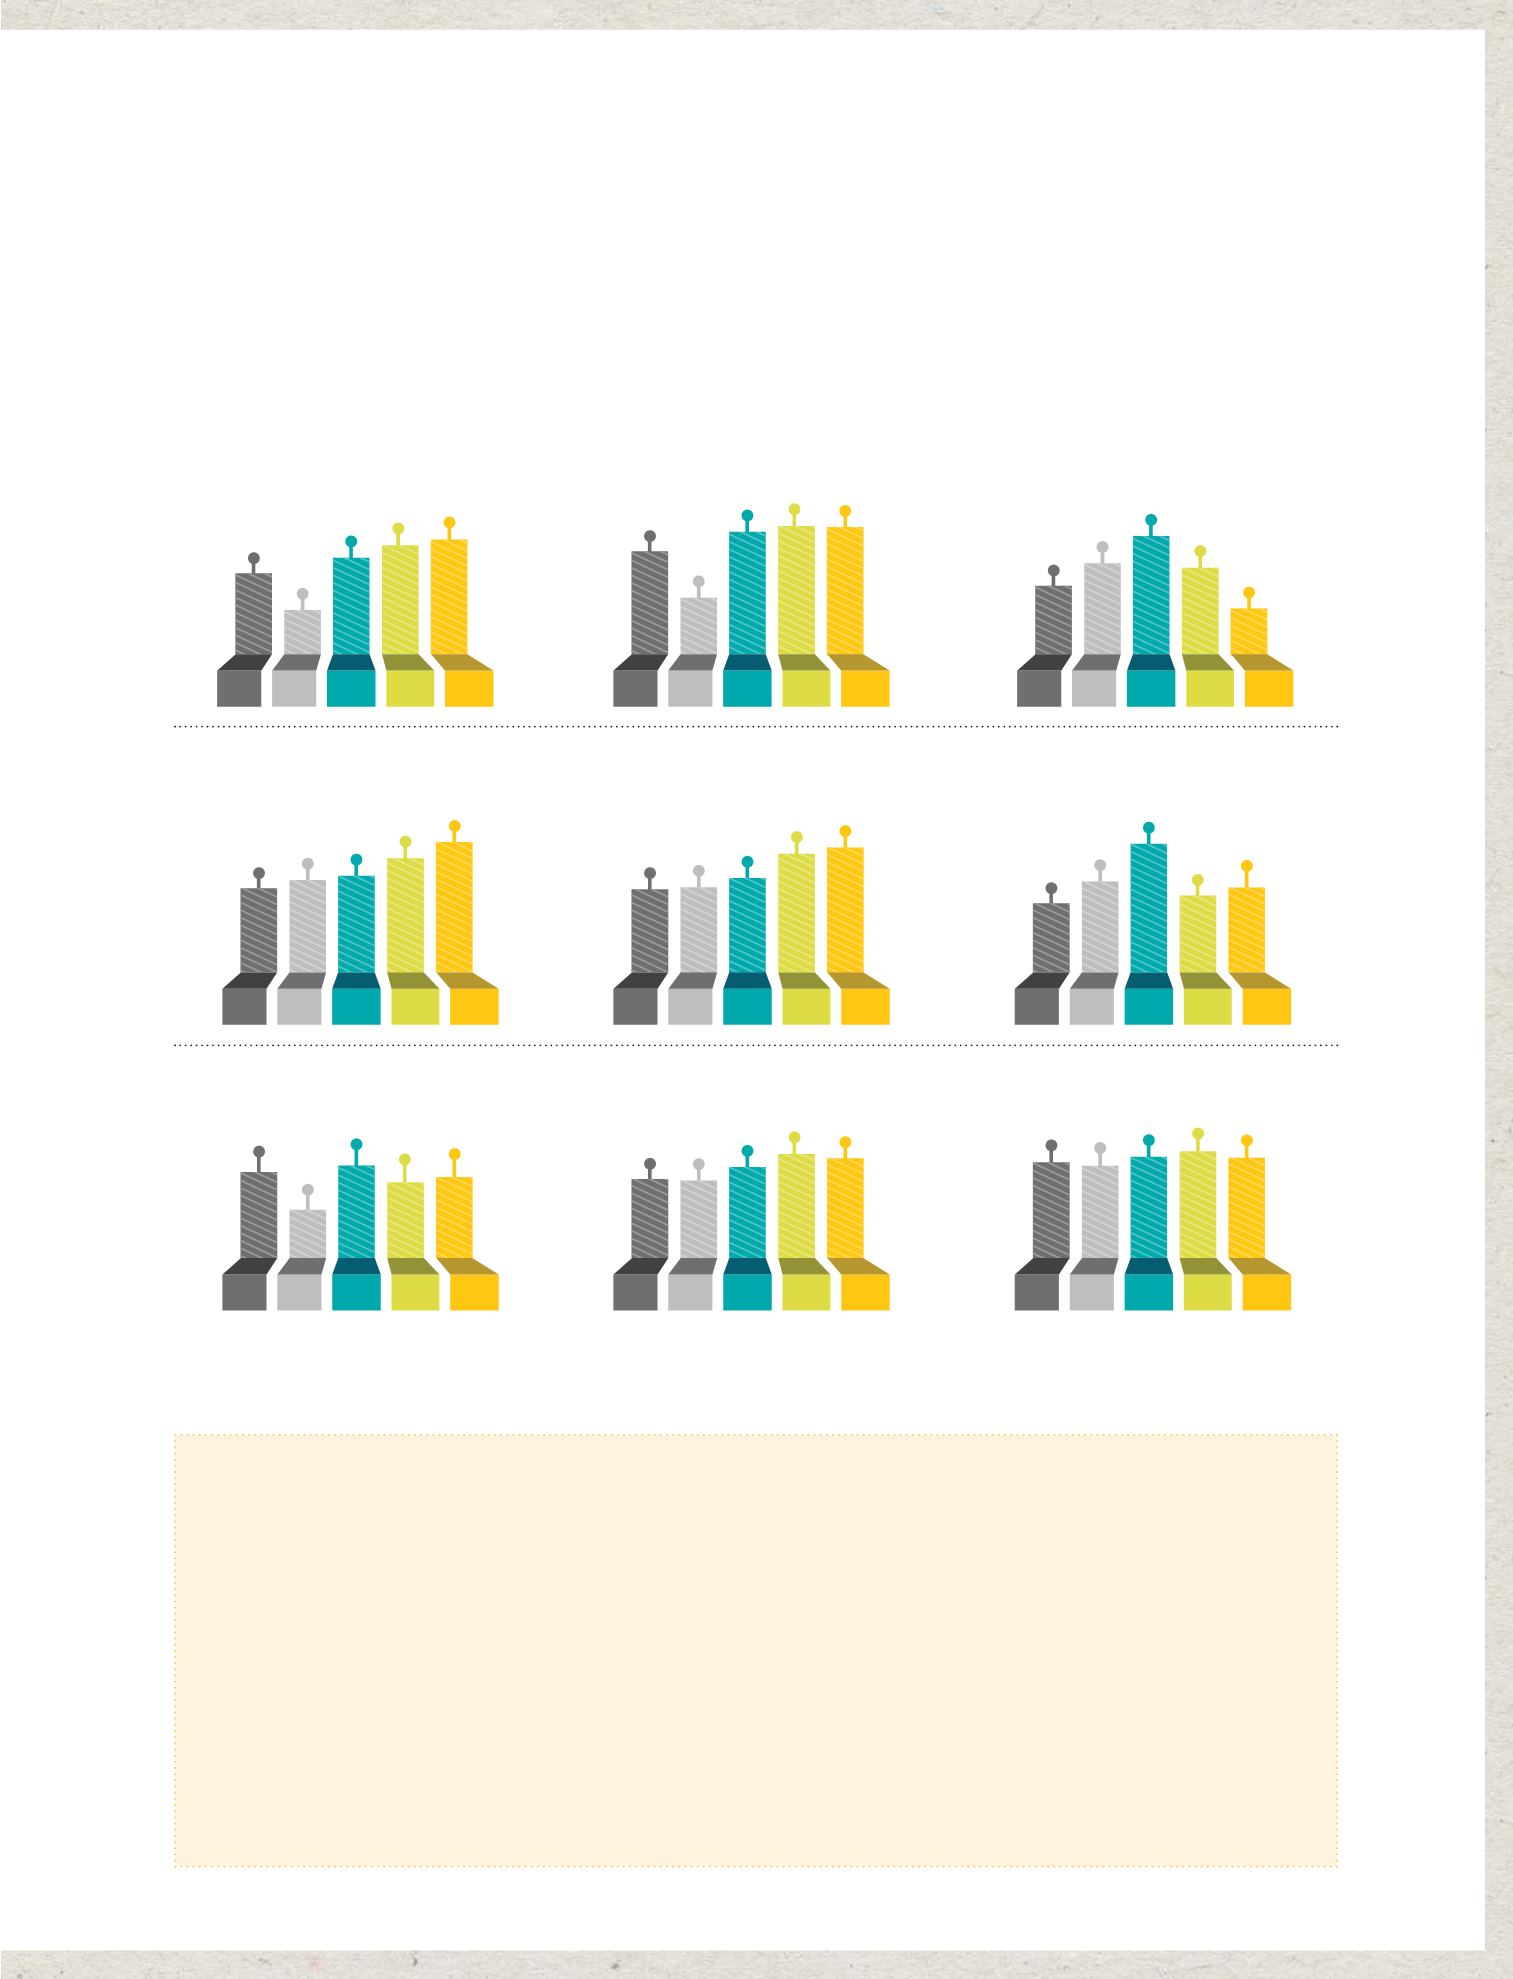
Total Assets
RM640.3
billion
Loans, Advances, and Financing
RM403.5
billion
Total Capital Ratio
16.235
%
^^
451.6 494.8
560.3
411.3
640.3
FY11 FP11* FY12 FY13
FY14
276.3
311.8
355.6
255.0
403.5
FY11 FP11* FY12 FY13
FY14
16.37
^
17.35
^
15.664
^^
15.36
^
16.235
^^
FY11 FP11* FY12 FY13
FY14
Net Profit
RM6.72
billion
Earnings Per Share
74.2
sen
Return on Equity
13.8
%
Gross Dividend Per Share
57.0
sen
Market Capitalisation
RM85.5
billion
36.0
65.0
53.5
60.0
FY11 FP11* FY12 FY13
FY14
65.5
77.6
88.1
66.9
FY11 FP11* FY12 FY13
FY14
8.58 9.20 9.94
8.94
FY11 FP11* FY12 FY13
FY14
Share Price
RM9.17
2.59
5.75
6.55 6.72
4.45
FY11 FP11* FY12 FY13
FY14
34.5
72.7 75.8
61.4
74.2
FY11 FP11* FY12 FY13
FY14
15.2
16.0
#
15.1
14.5
13.8
FY11 FP11* FY12 FY13
FY14
57.0
85.5
9.17
FINANCIAL HIGHLIGHTS
* Refers to six-month financial period ended 31 December 2011 due to the change of financial year end from 30 June to 31 December
#
Computed based on weighted reallocation of additional RM3.66 billion capital raised in October 2012
^
RWCR and assuming full reinvestment of Dividend Reinvestment Plan
^^
Total Capital Ratio (TCR) is computed in accordance with Capital Adequacy Framework (Capital Components) issued by Bank Negara Malaysia on 28 November 2012
Financial
Highlights